May 13, 2026
Evaluating agentic RAG for financial analysis: a FinanceBench study
May 2026 update. We re-ran this benchmark after a round of
/researchimprovements (a refactored agent executor, better section-summary retrieval, and two bug fixes in how the agent loop terminates a turn). At the same time we switched the LLM judge fromgpt-4o-minitoclaude-opus-4-7— see the Methodology update section for why. The headline numbers in this post reflect the new judge throughout, including the April baselines, so the comparisons are apples-to-apples.
In 2023, researchers at Patronus AI published FinanceBench [1], a benchmark of 150 financial analysis questions drawn from real SEC filings. The questions require locating specific figures across 10-K and 10-Q filings, computing ratios, comparing across periods, and reasoning about what the numbers mean. The kind of thing a junior analyst does every day.
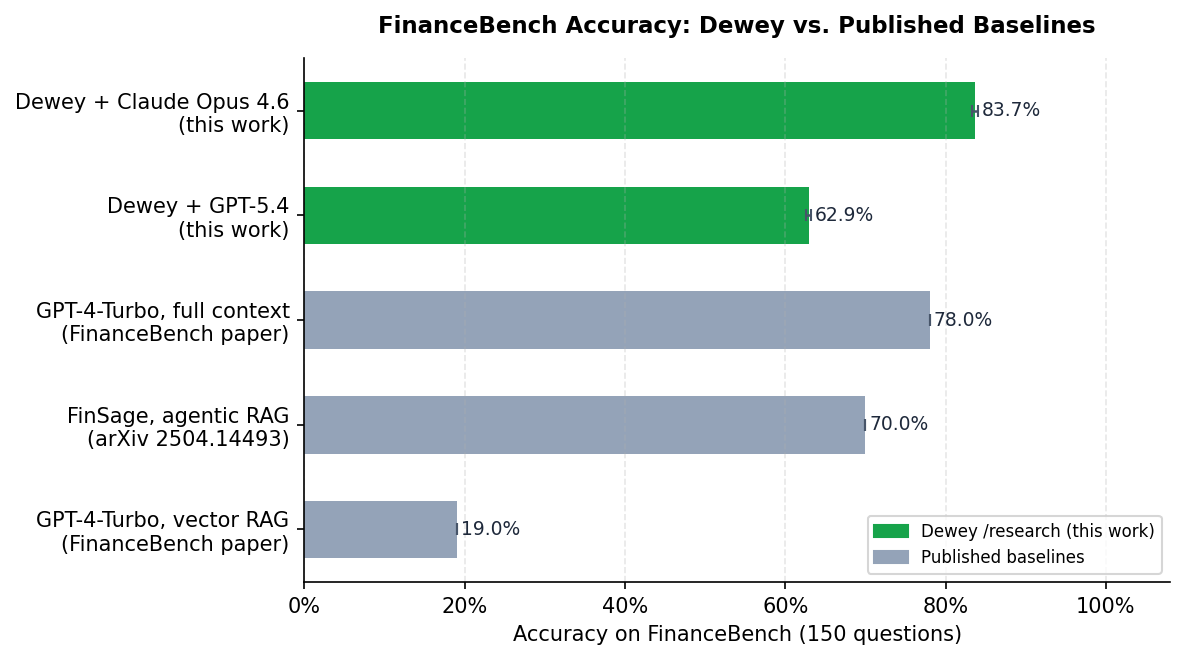
Their headline finding: retrieval-augmented generation with standard vector search got 19% of questions right. Putting entire SEC documents into a GPT-4 context window got 78%. The implication was that RAG, as typically implemented, was not up to the task of financial document analysis.
That gap matters in practice. Full-context retrieval is expensive, does not scale to large collections, and is bounded by context window size. A 100-page 10-K does not always fit; a 10-Q that references prior-year figures from the associated annual filing definitely does not. If traditional RAG cannot close the gap, financial document analysis needs a fundamentally different approach.
We ran Dewey's /research endpoint on all 150 FinanceBench questions to see where agentic retrieval lands.
What Dewey does
Dewey is a document research API. Give it a collection of SEC filings and a question like "What drove 3M's margin compression in FY2022?" It searches the collection iteratively, reads the returned chunks, and decides whether to keep going or synthesize an answer. At depth=exhaustive, the model can make up to 50 search calls per question. Documents are indexed once at ingest time, with optional LLM-generated enrichment (section summaries, table captions, image captions) stored alongside the raw text and returned as additional retrieval context.
Setup
We ingested the full FinanceBench document set into a Dewey collection and ran all 150 questions at depth=exhaustive. At this setting, the model can make up to 50 search calls before producing an answer.
We tested two primary configurations:
- Config A: GPT-5.4 as the reasoning model
- Config B: Claude Opus 4.6 as the reasoning model
We also ran ablation variants with document enrichment features disabled, and a third variant with an upgraded enrichment model. More on those below.
Each answer was scored in two stages: a numeric parser that applies a 2.5% relative tolerance (matching standard financial rounding conventions), followed by an LLM judge for everything that did not parse numerically. The judge used here is claude-opus-4-7. The original April 2026 run used gpt-4o-mini and re-ran the judge 10 times for 95% CI; we discuss why we switched in the Methodology update below.
Running all 150 questions at exhaustive depth requires a Dewey account with Anthropic and/or OpenAI API keys configured (BYOK is required at this depth setting). The collection is public. All benchmark code is at github.com/meetdewey/financebench-eval [2].
Results
| System | Accuracy | Notes |
|---|---|---|
| GPT-4-Turbo, vector RAG (FinanceBench paper, 2023) | 19.0% | human-judged |
| FinSage, agentic RAG (arXiv 2504.14493, 2025) | 70.0% | |
| Claude Opus 4.6, full context (this work) | 76.0%* | gpt-4o-mini judge |
| GPT-4-Turbo, full context (FinanceBench paper, 2023) | 78.0% | human-judged |
| Dewey + GPT-5.4 | 80.0% | |
| Dewey + Claude Opus 4.6 | 87.3% | |
| LinqAlpha (specialized system, LinqAlpha blog, 2024) | 97.2% | self-reported |
*Six PepsiCo 10-K filings (1.08–1.14M tokens) exceed Claude's 1M-token context limit and are scored as incorrect. Accuracy on the 144 answerable documents is 79.2%.
Dewey with Claude Opus 4.6 reaches 87.3%, above both full-context baselines in the table. GPT-5.4 reaches 80.0%, above its full-context predecessor and well above traditional vector RAG. LinqAlpha, a specialized financial analysis system, scores 97.2%, though it is a different category of product, one purpose-built for financial data rather than a general document research API.
For context on the trajectory since our original April 2026 post: under the same claude-opus-4-7 judge, GPT-5.4 moved from 66.0% to 80.0% (+14.0 pp) and Claude Opus 4.6 moved from 83.3% to 87.3% (+4.0 pp). The GPT-5.4 gain is driven by the agent executor refactor and improvements to scan_sections retrieval; the Opus gain plus a notable drop in average tool calls (more on that below) comes from a pair of bugfixes in how the Anthropic loop terminates a turn.
We also ran a matched full-context experiment: the same Claude Opus 4.6 model received each SEC filing directly in context, with no retrieval. It scored 76.0% under the original gpt-4o-mini judge (79.2% on the 144 documents that fit; six PepsiCo 10-K filings at 1.08–1.14M tokens exceed Claude's 1M-token limit). Dewey's agentic retrieval, same model, scores 87.3% on all 150, an 8.1-point gain with the conservative 76% comparison and an 11.3-point gain limited to the 144 questions full-context could attempt.
Comparisons with the original paper's GPT-4-Turbo baselines still mix model and architecture effects, since those used a different model from 2023.
Why Claude Opus 4.6 still leads, even at parity tool-call counts
In our April 2026 run, the two models behaved very differently. GPT-5.4 averaged 9.4 tool calls per question; Claude Opus 4.6 averaged 21.2. Opus's edge looked like a retrieval-coverage story — it searched twice as much, found more, answered better.
That divergence has collapsed. In this run both models average 8.0 tool calls per question. Opus came down from 21.2 to 8.0 without losing accuracy; in fact accuracy is up by 4 points. The Anthropic loop bugfixes deserve some credit (eliminating spurious extra searches), and the improvements to scan_sections retrieval mean each call is more informative, so the model converges faster.
So the new question is: with both models making the same number of searches, why is Opus still 7.3 points ahead?
The answer shows up in numerical reasoning:
| Question type | GPT-5.4 | Claude Opus 4.6 | n |
|---|---|---|---|
| Numerical reasoning | 93.0% | 100.0% | 43 |
| Information extraction | 90.3% | 93.5% | 31 |
| Mixed reasoning categories | 60.0% – 80.0% | 60.0% – 80.0% | 16 |
Opus is perfect on numerical reasoning — 43 of 43. GPT-5.4 misses 3 of 43, typically by computing a ratio from incomplete or wrong-period figures. Both models do well on information extraction (90% vs 94%); the gap is small and mostly within judge noise. The 7.3-point overall edge for Opus is concentrated in arithmetic-heavy questions that require chaining a calculation across two or three retrieved figures.
This is a different story from April. Then, the explanation was that Opus searched more thoroughly and found more facts. Now, both models retrieve roughly the same facts, but Opus is more reliable at executing a multi-step numerical computation on top of them. The retrieval system has gotten good enough that the bottleneck has shifted to reasoning.
The latency trade-off is also smaller than it was. Opus averaged 43.2 seconds per question (down from 69.5 in April), GPT-5.4 19.7 seconds (essentially unchanged). The 2.2× latency cost for an extra 7 accuracy points may or may not be worth it for your workload, but it is no longer a 3.4× cost.
The impact of document enrichment features
The ablation in this section was run in April 2026 and is reproduced here for reference. We did not re-run it for this update; numbers in the ablation table are scored under the original gpt-4o-mini judge and should be read as relative deltas within that block rather than absolute accuracy comparable to the headline.
When a document is ingested into Dewey, an optional enrichment pipeline runs over the parsed content and generates:
- Section summaries: an LLM-generated paragraph describing each section's content and key figures
- Table captions: structured descriptions of table contents and column semantics
- Image captions: descriptions of charts and graphs
These are embedded alongside the raw text and returned as additional retrieval context. The model generating them was gpt-4o-mini by default.
To measure their contribution, we re-ran both configurations with enrichment disabled. We also ran a third variant with gpt-5.4 handling enrichment instead of gpt-4o-mini.
| Configuration | Accuracy | vs. no enrichment |
|---|---|---|
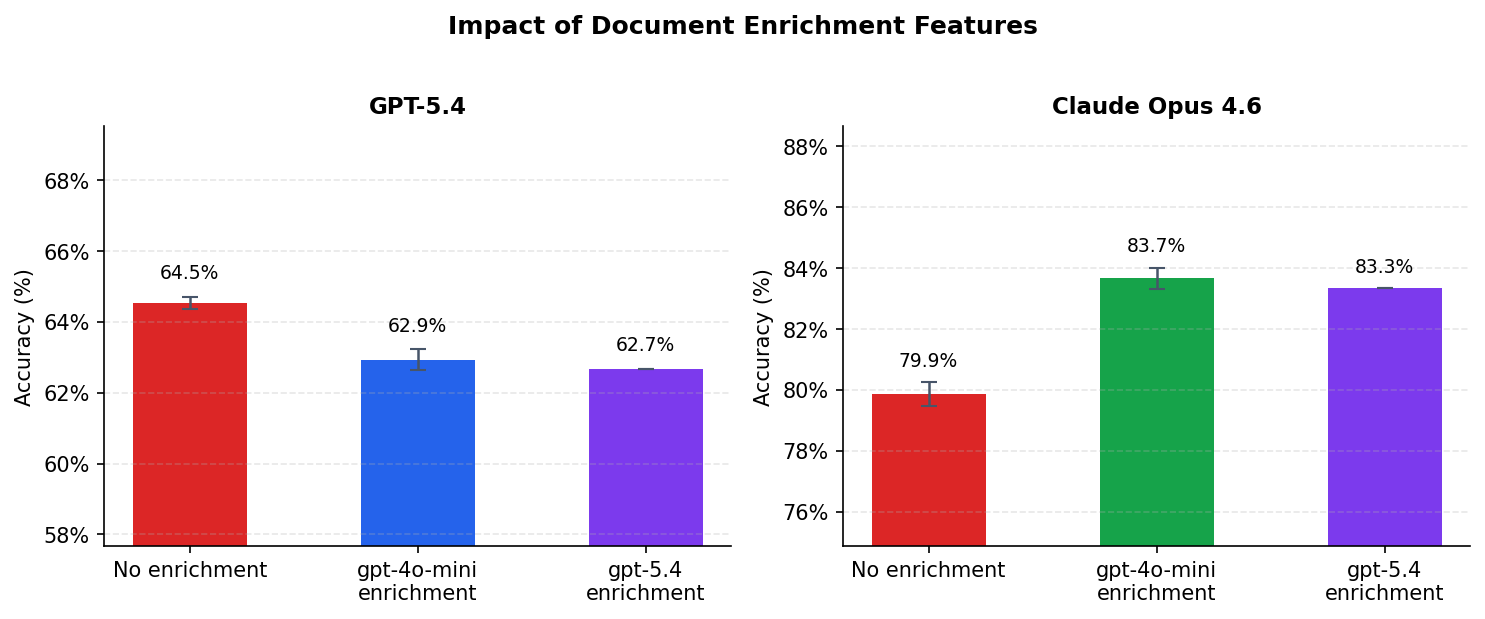
| GPT-5.4, no enrichment | 64.5% (±0.2%) | baseline |
| GPT-5.4, gpt-4o-mini enrichment | 62.9% (±0.3%) | -1.6 pp (p < 0.001) |
| GPT-5.4, gpt-5.4 enrichment | 62.7% (±0.0%) | -1.9 pp (p < 0.001) |
| Claude Opus 4.6, no enrichment | 79.9% (±0.4%) | baseline |
| Claude Opus 4.6, gpt-4o-mini enrichment | 83.7% (±0.4%) | +3.8 pp (p < 0.001) |
| Claude Opus 4.6, gpt-5.4 enrichment | 83.3% (±0.0%) | +3.5 pp (p < 0.001) |
Enrichment adds a statistically significant 3.8 points for Opus. For GPT-5.4, the same features produce a small but statistically significant decrease.
The GPT-5.4 result is counterintuitive but consistent across all runs and both enrichment models. Section summaries and table captions are most useful as navigation signals: they let a model scanning the index decide which sections warrant a full read without having to retrieve and parse raw text first. A model making 21-plus searches per question gets real value from that. A model making 9 targeted keyword searches does not, and the extra summary text may occasionally pull retrieval toward paraphrased content rather than source figures.
The per-type breakdown makes the GPT-5.4 result less mysterious. Enrichment helps on numerical reasoning (+4.7 pp), where table captions can directly surface the figures being sought. It hurts on information extraction (−12.9 pp) and logical/multi-step questions (−4.5 pp). For information extraction tasks, where the correct answer is often a specific verbatim value, the model retrieves from summary paraphrases rather than source text and introduces transcription error. So for targeted-retrieval models, enrichment is worth having when questions involve figure lookup, and worth skipping when they require verbatim extraction.
The other finding here: upgrading from gpt-4o-mini to gpt-5.4 for enrichment made no statistically significant difference (p = 0.10 for both models). The task of describing what a section contains and flagging its key figures is well within gpt-4o-mini's capability. There is no measurable return on using a frontier model for this step.
Qualitative examples
Segment performance attribution
Question: If we exclude the impact of M&A, which segment has dragged down 3M's overall growth in 2022?
Gold answer: The consumer segment shrunk by 0.9% organically.
Opus made 14 tool calls and constructed a full table of organic sales growth across all four 3M business segments before isolating the M&A effect. It correctly identified Consumer as the only segment with negative organic growth and distinguished it from Transportation and Electronics, which had larger headline declines driven primarily by divestitures rather than underlying demand.
GPT-5.4 also answers this correctly today, in 12 tool calls. In the April run it stopped at Transportation/Electronics with 17 calls; the improvements to scan_sections retrieval mean a model making 12 targeted searches now consistently surfaces the per-segment organic-growth disclosures that previously required deeper exploration. Both models now arrive at Consumer.
Capital intensity analysis
Question: Is 3M a capital-intensive business based on FY2022 data?
Gold answer: No. CAPEX/Revenue: 5.1%, Fixed assets/Total Assets: 20%, Return on Assets: 12.4%
Opus pulled three separate ratios from three different financial statements, reproduced the exact percentages in the gold answer, and reached the correct conclusion. The question is representative of the information-extraction category: the answer is not in one place, it requires assembling figures from the income statement, cash flow statement, and balance sheet.
Liquidity profile assessment
Question: Does 3M have a reasonably healthy liquidity profile based on its quick ratio for Q2 FY2023?
Gold answer: No. The quick ratio for 3M was 0.96 by Jun'23 close, which needs a bit of an improvement to touch the 1x mark.
GPT-5.4 (7 tool calls) computes the quick ratio from 3M's Q2 FY2023 balance sheet but reaches the opposite qualitative conclusion, characterizing 3M's liquidity as "reasonably healthy, though not especially strong." This is one of the questions where GPT-5.4 still falls short: the math is close but the qualitative judgment of what ~0.96 implies (acceptable vs. needs improvement) is open to interpretation, and the model lands on the more generous side. Opus answers this category of question correctly in the current run.
Where both models struggle: 10-Q filings
| Document type | GPT-5.4 | Claude Opus 4.6 | n |
|---|---|---|---|
| 10-K | 84.8% | 92.0% | 112 |
| 10-Q | 40.0% | 60.0% | 15 |
| 8-K | 100% | 88.9% | 9 |
| Earnings release | 71.4% | 78.6% | 14 |
10-Q accuracy remains poor for both models even after this round of improvements. Quarterly reports often reference prior-period figures from the associated annual filing, and those figures may not be reproduced in the quarterly document. When that happens, a model that searches the collection confidently may retrieve figures from the wrong period. The FinanceBench collection contains only the documents explicitly cited in the benchmark, so cross-period retrieval is sometimes not possible. Extending the collection with paired annual filings would likely narrow this gap substantially.
Methodology update
The original April 2026 post scored every answer with gpt-4o-mini and ran the judge 10 times per configuration to control for non-determinism. After re-running the benchmark we audited the cases where the old and new headline numbers disagreed most. Two patterns showed up:
gpt-4o-miniis over-strict on numeric rounding. It rejected93.87vs gold93.86,$1,615.9Mvs gold$1,616.00M, and$0.389Bvs gold$0.40B, all of which are within the ±2.5% tolerance that financial analysts and the benchmark's own scoring guidance accept.gpt-4o-miniis over-lenient on refusals and factual mismatches. It accepted as correct predictions that openly said "not explicitly presented" when the gold answer was a specific dollar figure, and predictions where the headline number differed from gold by 3× or more.
Running both scoring runs through claude-opus-4-7 instead corrected both patterns. On Config A (GPT-5.4), the two judges agreed on 88% of questions; on Config B (Claude Opus 4.6) they agreed on 87–94% depending on which run. In every disagreement we sampled, the Claude judge made the more defensible call.
To keep this post apples-to-apples, all headline numbers were re-scored with claude-opus-4-7, including the April baselines. Under that judge, the April baselines were 66.0% (GPT-5.4) and 83.3% (Opus 4.6) — close to but not identical to the originally-reported 62.9% and 83.7%. The post-re-run numbers (80.0% and 87.3%) are scored the same way.
We have not switched the in-pipeline scoring script in the public eval repo yet; the existing npm run score still uses gpt-4o-mini. The Claude judge variant is a small parallel script (judge-claude-compare.ts in the same repo) that wraps the same prompt against the Anthropic SDK.
Limitations
A few caveats:
Single ingestion. All results reflect one ingest with fixed chunking and embedding parameters. Retrieval quality is sensitive to these choices and we have not ablated them.
LLM judge vs. human evaluation. The original paper used human annotators. We use an LLM judge — see Methodology update above for the audit that led us to switch from gpt-4o-mini to claude-opus-4-7. The Claude judge agrees with the original judge on ~88-94% of questions and resolves the remaining disagreements in the direction we'd expect from manual inspection, but absolute accuracy figures may still differ somewhat from what human evaluation would produce.
Single judge pass. The original April run reported 10-run judge means with 95% CIs. This re-run reports single-pass numbers. The Claude judge's single-pass result for Config B (83.3% on the April predictions) lands within 0.4 pp of the gpt-4o-mini 10-run mean (83.7%), suggesting it is stable enough to use single-pass.
Model versions. GPT-5.4 and Claude Opus 4.6 are the reasoning-model versions used in this post; the judge is Claude Opus 4.7. Comparisons against the original paper's GPT-4-Turbo baseline reflect improvements in both the retrieval system and the underlying models.
Reproducing these results
The document collection is publicly accessible. You can run your own queries against the same 150 filings here.
To reproduce the full benchmark, you will need a Dewey account with OpenAI and Anthropic API keys configured under the API Keys panel on your dashboard (BYOK is required for exhaustive depth). Then:
git clone https://github.com/meetdewey/financebench-eval
cp .env.example .env   # add your DEWEY_API_KEY and OPENAI_API_KEY (for the judge)

npm install
npm run ingest         # ~30 min: uploads SEC filings to Dewey
npm run run            # ~6 hrs at concurrency=2
npm run score          # ~5 min
npm run report
npm run ci -- --runs 10
All code is at github.com/meetdewey/financebench-eval [2].
What this adds up to
The original FinanceBench paper showed a 59-point gap between vector RAG and full-context retrieval. Agentic retrieval now closes that gap and, with the same model, surpasses full-context by 11.3 points while also handling documents that do not fit in context at all.
When we wrote the April version of this post, our story was that the key variable was retrieval depth — how many calls the model makes before deciding it has enough. With this re-run, both GPT-5.4 and Claude Opus 4.6 average 8 tool calls per question, yet Opus is 7.3 points ahead overall and perfect on numerical reasoning. The retrieval system has gotten good enough that the bottleneck has shifted from "did you find the right passages" to "can you correctly compute the answer across them." That is a more familiar bottleneck and one we expect to track frontier-model improvements going forward.
The April finding on enrichment — that a feature which adds 3.8 points for one model actively hurts the other — was reproduced here only at the level of architecture, not freshly measured. The ablation section above remains historical; if you are building on top of Dewey we still recommend keeping enrichment on by default, but if you are using a model that issues few targeted searches it is worth measuring the effect on your workload.
For teams building financial RAG systems, the practical question now is whether your model can reliably reason across the figures it has retrieved, not whether it can retrieve them in the first place. Pick a model with strong numerical execution if your questions involve multi-step computation; the retrieval coverage gap has narrowed enough that the model choice now matters more than the search budget.
Disclosure: Dewey AI, Inc. developed and operates the system evaluated in this post. All benchmark code and the document collection are publicly available for independent verification at the links above.